Industry News, R&D, Coatings
Biobased Succinic Acid: The Flexible, Hard Renewable Acid

Industry News, R&D, Coatings

Biobased succinic acid (SA) is a four-carbon diacid that is easily produced by direct glucose fermentation using a modified yeast or bacteria. Prior to the advances in yeast-catalyzed molecular engineering, succinic acid was typically obtained from petrochemical sources such as either a benzene oxidation/reduction process or more commonly from the partial oxidation of butane. Both of these processes involve the use of finite petrochemical feedstocks and multiple high-temperature and high-pressure conversion steps that produce significant amounts of CO2 emissions and thus add to greenhouse gas emissions, global warming and higher subsequent environmental costs. With the recent advances in biotechnology, biobased succinic acid has emerged as an extremely versatile and environmentally friendly chemical building block. BioAmber’s highly efficient yeast-based fermentation process produces a high-quality polymerization-grade succinic acid. The efficient process reduces CO2 emissions and saves energy compared to analogous petrochemical-based organic acids such as petroleum-based succinic acid, adipic acid and aromatic acids such as o-phthalic acid or isophthalic acid. Moreover, BioAmber completed its 30,000T capacity manufacturing facility in Sarnia, Ontario in August, 2015 – the largest manufacturing plant for biobased succinic acid. These technical and manufacturing advances enable the use of biobased succinic acid as a versatile new platform chemical in the development of biobased polyester thermoplastics, polyester polyols for urethanes, epoxies, acrylates, and saturated or unsaturated polyester resins for a variety of CASE applications. In addition to these high-performance polymers, the availability of high-quality biobased succinic acid enables a variety of other chemical intermediates derived from succinic acid such as ester-based solvents, lubricants, plasticizers and even agrichemicals.
BioAmber recently published several articles on the features and benefits of succinate polyols in polyurethanes, thermoplastics, coatings and adhesives.1a-c We have now extended our application knowledge to polyester resins, such as those used in solventborne metal coatings. In this article we will highlight and summarize the performance attributes of biobased LPE resins as protective coatings for metals.2 Several well-known technologies are available for metal coating applications. Typically, these resins are based on polyester, epoxy and acrylic chemistries. Within each of these technologies there are numerous formulation variables used to customize metal coatings to meet the application performance requirements. Regardless of the ultimate application, the coatings are primarily used to protect the metal from oxidation (corrosion). In order for the coating to accomplish this primary function, it must have excellent adhesion to the metal surface, be stable to UV and chemical attack and form a hard, scratch-resistance surface. However, just having the polyester form a “hard coating with excellent adhesion” is insufficient. The final coating also needs to be flexible in order to survive the metal fabrication processes for conversion into numerous shapes for applications such as metal siding, office furniture, automotive and industrial applications. It is this need to balance the hard, durable properties with flexible and impact-resistant properties that make the metal coating formulation such a challenge. For polyester-based resins, this balance of properties is achieved by the polymer design that balances harder, stiffer ester units based on aromatic acids, or cycloaliphatic acids and glycols with flexible segments based on aliphatic acids and aliphatic glycols. Typically ester repeat units of isophthalic acid (IPA) and neopentyl glycol/ethylene glycol (NPG/EG) would be considered the hard/stiff segments, whereas ester units based on adipic acid (AA) and NPG/EG would be considered soft and flexible. Moreover, the use of biobased SA enables the synthesis of “greener” formulations using less petrobased carbon.
| Synpo Paper Formulation # | F12 | F13 | F4 | F1 | F5 | F10 | F7 | F8 | F9 |
| Resin # | 1 | 2 | 3 | 4 | 5 | 6 | 7 | 8 | 9 |
| Isophthalic acid (wt%) | 57.2 | 56.6 | 49.1 | 47.7 | 43.4 | 41.4 | 35.3 | 34.4 | 35.8 |
| Adipic acid | 0.0 | 5.6 | 0.0 | 14.0 | 0.0 | 19.8 | 7.4 | 20.2 | 0.0 |
| Bio succinic acid | 4.6 | 0.0 | 11.6 | 0.0 | 16.6 | 0.0 | 16.8 | 5.9 | 23.1 |
| Neopently glycol | 30.4 | 30.1 | 31.4 | 30.5 | 31.9 | 30.7 | 32.3 | 31.5 | 32.8 |
| Ethylene glycol | 7.8 | 7.7 | 8.0 | 7.8 | 8.2 | 7.9 | 8.2 | 8.0 | 8.3 |
| Mole-% acids | |||||||||
| Isophthalic acid | 0.90 | 0.90 | 0.75 | 0.75 | 0.65 | 0.65 | 0.52 | 0.52 | 0.52 |
| Adipic acid | 0.00 | 0.10 | 0.00 | 0.25 | 0.00 | 0.35 | 0.12 | 0.35 | 0.00 |
| Bio succinic acid | 0.10 | 0.00 | 0.25 | 0.00 | 0.35 | 0.00 | 0.35 | 0.13 | 0.48 |
| Mole-% glycols | |||||||||
| Neopentyl glycol | 0.70 | 0.70 | 0.70 | 0.70 | 0.70 | 0.70 | 0.70 | 0.70 | 0.70 |
| Ethylene glycol | 0.30 | 0.30 | 0.30 | 0.30 | 0.30 | 0.30 | 0.30 | 0.30 | 0.30 |
| Glycol/acid ratio | 1.09 | 1.09 | 1.09 | 1.0 | 1.09 | 1.10 | 1.09 | 1.09 | 1.09 |
| Final hydroxyl number (OHV, mg-KOH/g) | 33.7 | 45.2 | 40.9 | 44.8 | 43.1 | 50.2 | 44.2 | 44.7 | 42.4 |
| Final acid number (AN, mg-KOH/g) | 3.7 | 4.0 | 3.4 | 4.3 | 5.2 | 3.5 | 4.1 | 4.2 | 3.8 |
| Time to reach AN (hrs) | 11.0 | 9.0 | 9.0 | 9.0 | 9.5 | 9.0 | 11.0 | 12.0 | 12.0 |
| Wt% of biocarbon content of resins | 2.9% | 0.0% | 7.6% | 0.0% | 11.3% | 0.0% | 11.8% | 3.9% | 16.5% |
| Vis-resin 130°C (P-CAP #5) | 81.0 | 43.0 | 44.5 | 17.1 | 17.3 | 12.6 | 24.0 | ||
| Vis-resin 140°C (P) | 43.5 | 24.9 | 25.4 | 10.2 | 10.5 | 8.4 | 14.2 | ||
| Vis-resin 150°C (P) | 76 | 51 | |||||||
| Vis-65% solids, 25°C | 8700 | 7800 | 5580 | 2850 | 4380 | 1620 | 1980 | 1140 | 2550 |
| Tg-DSC (neat resin, °C) | 43 | 37 | 29 | 16 | 19 | 4 | 5 | 3 | 9 |
| Softening pt (RB method, °C) | 91 | 82 | 68 | 74 | 68 | 53 | 52 | 44 | 62 |
The formulations used to make the example polyester resins 1-9 and some of their physical properties are shown in Table 1. There were no significant differences noted in the preparation of the resins. The resin synthesis of IPA or AA by SA proceeded without any noticeable impact on reaction rate. The neat resins were converted to crosslinkable coating systems by the incorporation of three parts of hexamethoxy melamine crosslinker to seven parts of neat resin on a dry weight basis. The coating solutions were cast on untreated clean, degreased steel panels using a drawdown bar to make a cured coating with a dry coating thickness of 55-60 um. The coatings were cured at 140 °C for 1 hr to ensure the network was fully formed.
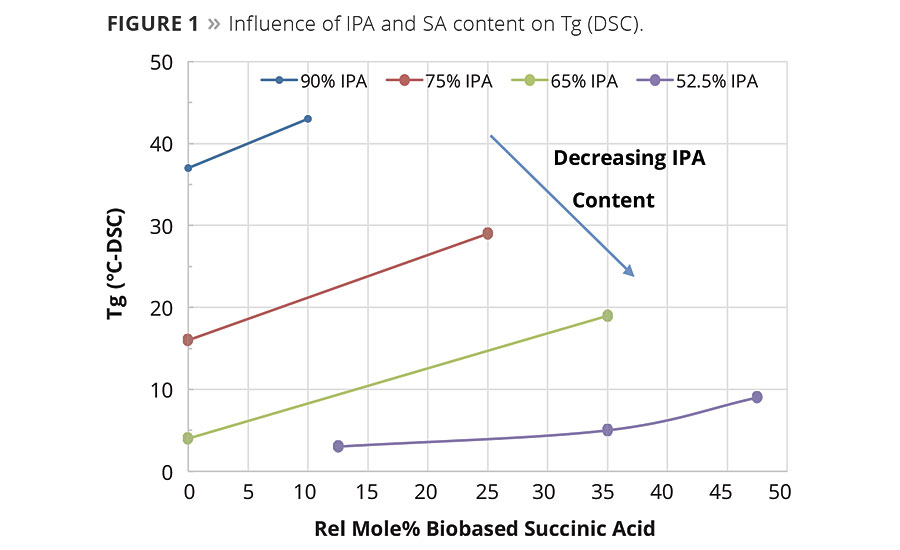
Figure 1. Influence of IPA and SA content on Tg (DSC). © PCI
The condensation reaction proceeded as expected and no significant differences were noted in the reaction rates between resins made with petrobased AA and biobased SA. As determined by DSC, the equimolar replacement of AA by SA increased the glass transition temperature of the polyester resins. As shown in Table 1 and graphically in Figure 1, the replacement of AA by SA at a fixed equivalent ratio of IPA resulted in an increase in Tg and viscosity. However, when SA replaced both IPA and AA, SA lowered the value of both of these properties. This suggests that IPA has a more significant influence on glass temperature and viscosity than SA. The increase in the glass temperature observed when SA replaces AA is a reasonable expectation and has been seen in TPU and powder coatings resins.1c What is perhaps more interesting is that as the amount of SA increased at the expense of AA and IPA the change in Tg, while still significant, was less dramatic as more of the IPA was replaced in the compositions. For example, as shown in Figure 1, the DSC data for the change in glass temperature of the resin made with 75 mole-% IPA was Tg of 13 °C when the SA replaced the AA. Whereas for the resin made with 52.5% IPA, the 40% change in SA content only increased the Tg from 3 to 5 °C, which is likely within the variability limits of the DSC.
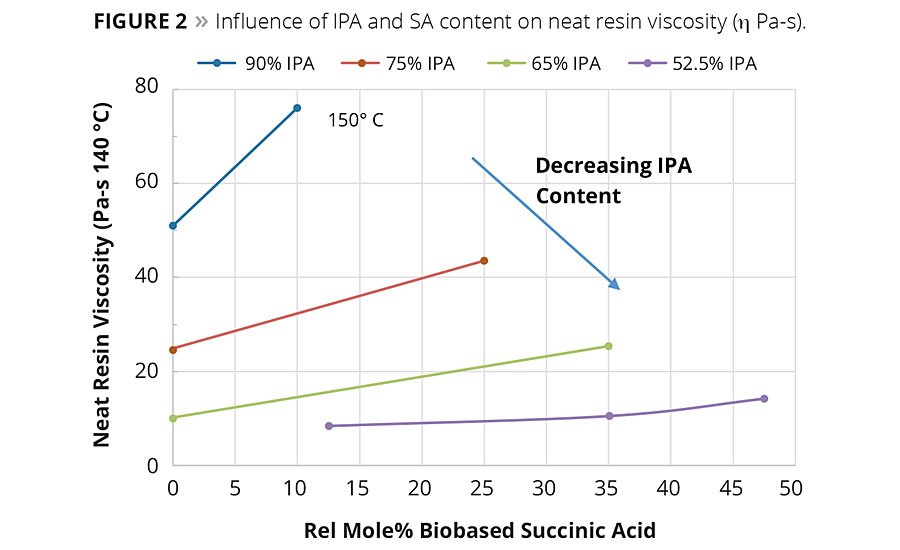
Figure 2. Influence of IPA and SA content on neat resin viscosity (η Pa-s). © PCI
In general, SA can be expected to increase the neat rein and solution viscosity compared to the same molar equivalents of AA. However, again as shown in Figure 2, the IPA content plays a significant factor in the overall viscosity change. For example, the influence of the IPA content on viscosity of Resins 1 and 2 was so significant at 90% IPA that the neat resin viscosity had to be measured at 150 °C compared to 140 °C for Resins 3-9. These observed viscosity trends suggest reducing IPA from the acid mixture and replacing it with IPA could bring a significant reduction in the viscosity of the coating solution. Figure 3 shows the solution viscosity at 65% resin content in Hydrosol A200/ethylene glycol monobutyl ether solvent blend. As expected, the same trends in solution viscosity are noted as with the neat resins. These data suggest the lower viscosity of Resin 5 (65/35 IPA-SA) compared to Resin 3 (75/25 IPA-SA) combined with its similar coating properties (discussed later) could enable a coating system with lower VOCs or enable a formulator to use a higher molecular weight resin.
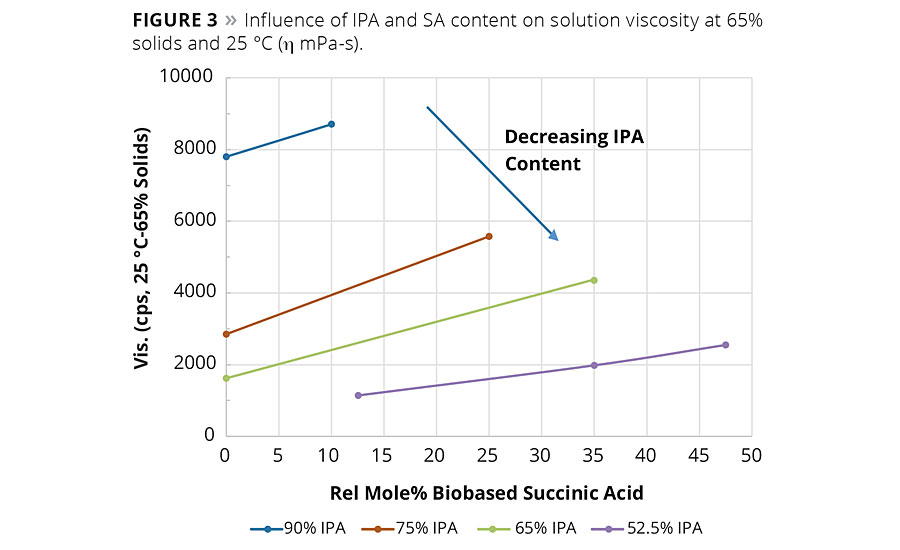
Figure 3. Influence of IPA and SA content on solution viscosity at 65% solids and 25°C (η mPa-s). © PCI
The influence of SA on the glass temperature and viscosity of the resin can be rationalized by comparing the molecular structures of the three different acids, IPA, SA and AA, as shown in Figure 4. In order to explain the influence of molecular structure on these critical process and performance variables, one can consider the number of carbons between the carbonyl ester groups and the molecular orbital hybridization of the carbons as contributing factors to explain these observations. IPA with its aromatic ring structure and Sp2 hybridized carbons force the carbon bonds of the polyester into a more rigid, trigonal planar geometry with fewer degrees of rotational freedom, even though IPA has one more carbon atom between acid groups than SA. Therefore, a polyester repeat unit formed with more IPA segments will have a higher energy barrier to bond rotation, which accounts in part for the higher Tg and viscosity of resin. In contrast, SA and AA are both aliphatic diacids with Sp3 hybridization and tetrahedral bond geometry. This enables greater chain mobility and lowers the rotational energy barrier of the C-C bond rotation, and thus its glass temperature. Moreover AA has four Sp3 hybridized carbons between acid groups compared to two for SA, and this contributes to an even lower glass temperature and viscosity relative to comparative SA polyester resins. The intensity of these changes as a function of IPA content suggests that IPA drives these two opposing parameters more strongly than either SA or AA.
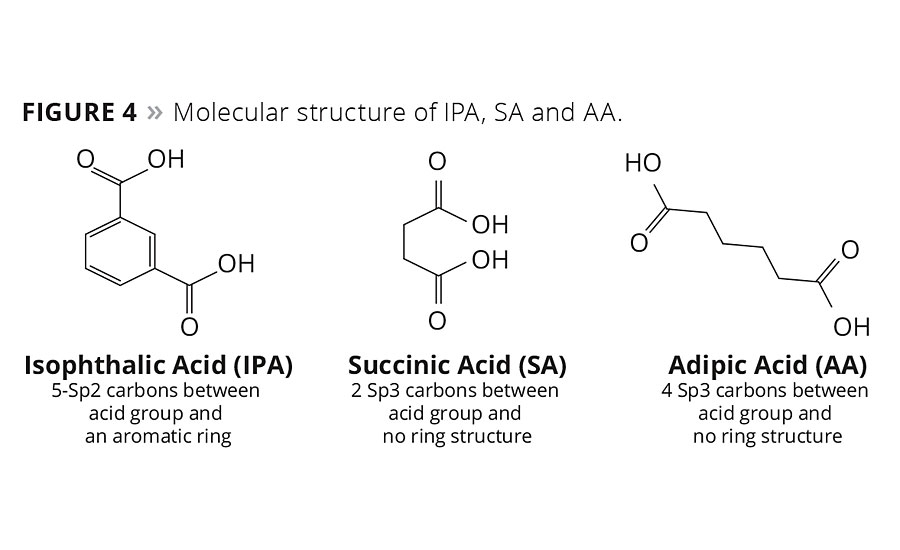
Figure 4. Molecular structure of IPA, SA and AA. © PCI
The polyester resins were cured using hexamethoxy melamine. This is a well-known crosslinking agent for acid or hydroxyl-terminated polyesters. The melamine crosslinks form a very stable, 3D polymer network with excellent end physical properties. The cured polyester coatings were prepared using a simple drawdown coating method to form a dry coating thickness of about 50-60 um. In all cases, the coatings were cured at 140 °C for 1 hr. This extended cure time allowed for the complete cure of the resin network and aided in the analysis of the evolution of the cure as a function of time. The hardness values of coatings 1-9 were characterized by pendulum and micro hardness using glass panels. The evaluation of the other coating parameters was made on clean steel panels. The data are summarized in Table 2. Several attempts were made to make satisfactory coatings from the highest IPA content (Resins 1 and 2) with 90/10 IPA/SA and 90/10 IPA/AA. However, these resins had exceedingly high viscosity values and poor solubility in the solvent. Thus it was not possible using our lab technique to make coatings of sufficient quality for evaluations, and therefore no further characterization data for these coatings were generated. The mechanical properties of these coatings were conducted using well-known test techniques to benchmark flexibility, adhesion, toughness to both slow and fast bending stress, and of course to resistance to solvents. These properties were evaluated using a combination of ISO and ASTM methods (Table 2). We noted that essentially the total replacement of AA by SA and the partial replacement of IPA by SA resulted in coatings that had excellent performance to these mechanical tests.
| Resin # | 1 | 2 | 3 | 4 | 5 | 6 | 7 | 8 | 9 | |
| Comments | Highest IPA Content | High IPA Content | Med IPA | Low IPA | ||||||
| IPA (relative mole-% acid) | 90.0 | 90.0 | 75.0 | 75.0 | 65.0 | 65.0 | 52.5 | 52.5 | 52.5 | |
| AA | 0.0 | 10.0 | 0.0 | 25.0 | 0.0 | 35.0 | 12.5 | 35.0 | 0.0 | |
| SA | 10.0 | 0.0 | 25.0 | 0.0 | 35.0 | 0.0 | 35.0 | 12.5 | 47.5 | |
| Coatings Test on Glass | ||||||||||
| Cured with Cymel™ 303 at 140 °C/1 hr | No caoting data-poor quality | |||||||||
| Thickness (um) | ~60 | ~60 | ~60 | ~60 | ~60 | ~60 | ~60 | |||
| Cured resin Tg (DSC) | ISO 11357 | 47 | 30 | 21 | 26 | 27 | 8 | 26 | ||
| Pendulum hardness | ISO 1522 | 89 | 86 | 85 | 44 | 86 | 21 | 58 | ||
| Micro hardness (MPa) | ISO 14577-1 | 206 | 203 | 205 | 81 | 54 | 11 | 125 | ||
| MEK-rub test | ASTM D4752 | > 5 min | > 5 min | > 5 min | 4.5 min | > 5min | > 5min | > 5min | ||
| Coatings Test on Metal | ||||||||||
| Flexural test (diameter to crack-Mandral bend test) | ISO 1519 | No coating data-poor quality | <3 mm | < 3 mm | < 3 mm | < 3 mm | < 3 mm | < 3 mm | < 3 mm | |
| Impact (500 g-100 cm height) | ISO 6272 | 100 | 100 | 100 | 100 | 100 | 100 | 100 | ||
| Revese impact | 100 | 100 | 100 | 100 | 100 | 100 | 100 | |||
| Erichsen cupping test | ISO 1520 | > 8 mm | > 8 mm | > 8 mm | > 8 mm | 7.5 mm | > 8 mm | > 8 mm | ||
| Adhesion (cross hatch adhesion) | ISO 2409 | 1 | 0 | 0 | 0 | 0 | 0 | 0 | ||
| MEK abrasion resistance (Time to damage coating) | ASTM D4752 | > 5 min | > 5 min | > 5 min | > 5 min | > 5 min | > 5 min | > 5 min | ||
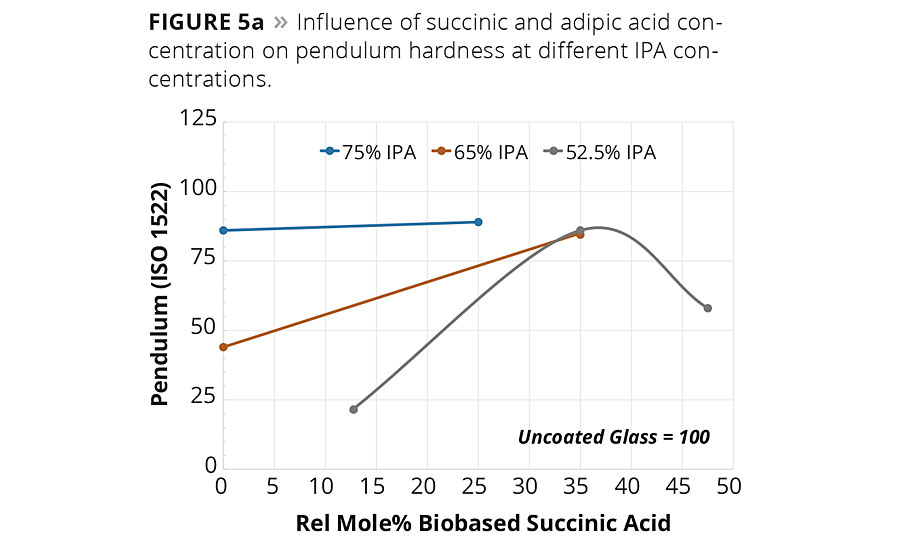
Figure 5a. Influence of succinic and adipic acid concentration on pendulum hardness at different IPA concentrations. © PCI
Of the many critical performance parameters for metal coatings, the surface hardness of the coating and its adhesion to the surface are key attributes needed for the coating to perform its surface protection role. The coatings were allowed to cure fully at 140 °C for 1 hr, and the values were determined using both pendulum hardness (ISO 1522) and micro hardness. The hardness values are summarized in Table 2 and are shown graphically in Figures 5a (pendulum hardness) and 5b (micro hardness).
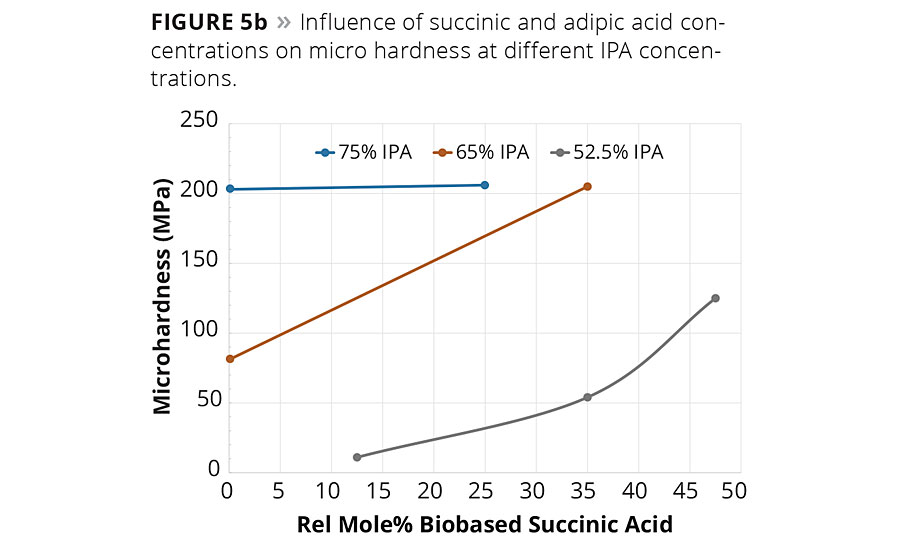
Figure 5b. Influence of succinic and adipic acid concentrations on micro hardness at different IPA concentrations. © PCI
The hardness data shown in Figures 5a and 5b suggests that the replacement of AA by SA will increase hardness of the coating at a fixed IPA level. However, the impact of SA content on coating hardness is more pronounced at lower IPA contents used in this study. The micro hardness values shown in Figure 5b suggest that a 65/35 IPA-SA has the same hardness as 75-25 IPA-AA, while the 52.5-47.5 IPA-SA exhibited overall lower micro hardness.
However, note in Figure 5a the pendulum hardness values for Resins 3, 5 and 7 are in the 80s even though the IPA content decreases from 75 to 53 mol-%. Moreover, coatings 1-9 all had excellent metal adhesion, even in the lower hardness ranges. These data suggest the use of SA in place of AA and IPA will still form a hard polyester coating with excellent adhesion and other mechanical properties.
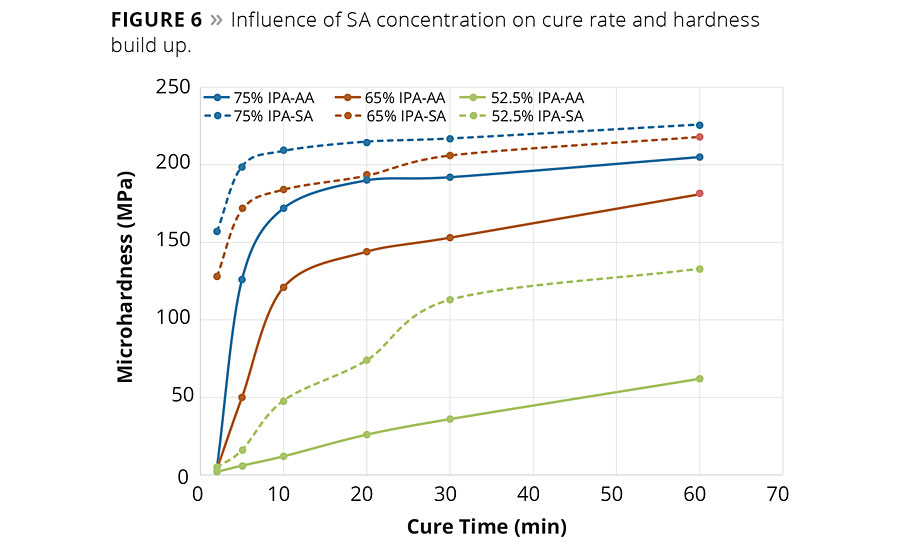
Figure 6. Influence of SA concentration on cure rate and hardness build up. © PCI
In addition, the influence of succinic acid and IPA content on the rate of hardness build up was studied. In these studies, the coated panels were prepared and cured as before, but the panels were removed at various time intervals during the 1 hr cure cycle and the surface hardness of the coatings were determined by micro hardness. These hardness values as a function of the cure time are graphed in Figure 6. Clearly it was observed that in each series, at each time interval, resins with higher IPA content increased the hardness of the coating. However, it can be noted from these data that at any given level of IPA, as the SA replaced the AA the hardness value is also higher. Moreover, it appears that the rate of hardness build up was faster with an SA-based composition than the rate of hardness buildup with an AA-based composition. This observation suggests that both IPA and AA can be replaced by SA to possibly modify the hardness range and also the cure rate, which suggests a potential to realize productivity gains by reducing cycle times.
As discussed earlier, the most critical function of a coating is the ability to impede corrosion of the metal substrate. We therefore evaluated the initial corrosion resistance performance of these coatings by neutral salt spray according to EN ISO 9227 and exposure to condensed sulfur dioxide (SO2 exposure) by EN ISO 6988. The metal coatings were prepared as before and subjected to the corrosion test condition. As called out in the specification, a scribed mark was made into the coatings to provide an exposed metal surface, and the coatings were tested for 168 hrs in the test environment. After this exposure time the panels were evaluated for blistering, rusting, cracking, flaking and delamination according to EN-ISO 4628 2-5.3 The corrosion ratings data shown in Table 3 represent an average of the corrosion ratings observed from four identical test panels.
| Sample | Content | Neutral Salt Spray 168 Hrs | Wet SO2 Exposure 168 Hrs | ||||||||
| Blister | Rusting | Cracking | Flaking | Adh. | Blister | Rusting | Cracking | Flaking | Adh. | ||
| 3 | 75-IPA 25-SA |
3.5 | 4.0 | 0.0 | 0.0 | < 0.5 | 0.0 | 1.0 | 0.0 | 0.0 | < 0.5 |
| 4 | 75-IPA 25-AA |
4.0 | 3.5 | 0.0 | 0.0 | < 0.5 | 2.0 | 1.0 | 0.0 | 0.0 | 0.0 |
| 5 | 65-IPA 35-SA |
4.0 | 3.5 | 0.0 | 0.0 | < 0.5 | 0.0 | 0.0 | 0.0 | 0.0 | < 0.5 |
| 7 | 53-IPA 35-SA |
4.0 | 4.0 | 0.0 | 0.0 | < 0.5 | 0.0 | 0.0 | 0.0 | 0.0 | < 0.5 |
| 9 | 53-IPA 35-AA |
4.0 | 4.0 | 0.0 | 0.0 | < 0.5 | 1.5 | 0.0 | 0.0 | 0.0 | < 0.5 |
The aromatic acid IPA is considered critical to prevent corrosion, however these initial data suggest the SA had no negative impact on the ability of the polyester coating to impede corrosion formation. Even when the IPA content was decreased from 75 to 53%, the use of SA still inhibited corrosion formation in wet SO2 exposure and still had similar ratings, albeit lower corrosion inhibition ratings in neutral salt spray testing.
The optical performance of the polyester coatings was determined according to ISO 16474-3, which is similar to ASTM G154 accelerated weathering in a Q-UV chamber. This test exposes the coated panels to intense 340 nm UV light in combination with a humidity exposure. The panels were exposed at 60 °C to 8 hrs of continuous UV light with an intensity of 0.89 W/m2/nm. This was then followed by a 4-hr condensation phase with no UV light at 95% RH and 50 °C. The total exposure time was 1000 hrs corresponding to 667 hrs of continuous UV exposure. Unlike the coated panels used for the corrosion tests, these samples were pigmented with 15% of TiO2. The change in yellowing was determined according the CIE scale, and gloss values were determined at 60°. The change in yellowing and gloss values are reported for a selection of the polyester coatings to represent a high, medium and low level of IPA corresponding to 25, 35 and 47% of SA content in the polyester composition, and are shown in Table 4. In nearly all cases the polyester coatings with the highest amount of SA had a lower D-gloss and Db* values. The improved values are likely attributed to the aliphatic nature of the SA.
| Sample | Content | Q-UV Testing 1000 Hrs | |||||
| Gloss-Initial | Gloss-Final | Δ-Gloss | b*Initial | b*Final | Δ-b* | ||
| 3 | 75-IPA 25-SA |
96 | 72 | 24 | 0.6 | 0.84 | +0.24 |
| 4 | 75-IPA 25-AA |
92 | 66 | 26 | 0.77 | 1.02 | +0.25 |
| 5 | 65-IPA 35-AA |
93 | 72 | 21 | 0.86 | 1.02 | +0.16 |
| 6 | 65-IPA 35-AA |
95 | 70 | 25 | 1.03 | 1.52 | +0.49 |
| 8* | 53-IPA 12-SA |
94 | 78 | 16 | 1.01 | 1.33 | +0.32 |
| 9 | 53-IPA 47-SA |
94 | 70 | 24 | 0.91 | 0.94 | +0.02 |
In most cases the change in the mechanical properties were not significantly impacted by UV exposure. The mandrel bend, cupping, adhesion and impact results were not affected by the presence of SA after 1000 hrs of exposure, suggesting the polyesters with SA will perform similarly to a high IPA but with improved yellowing and gloss resistance. The only changes noted in the physical properties of the coatings was for the reverse impact test, which did show a loss in impact strength, but this was noted for all resin compositions except for Resin 8 (53/35/12 IPA-AA-SA) and suggests of potential synergies between the use of mixed aliphatic acid in the resin system.
This application study shows that biobased SA can be used as a diacid to replace IPA and AA in a polyester resin for metal coatings. The biobased SA can be used to broaden the formulation window for these resins and allows for coatings with excellent mechanical properties but with different viscosity ranges, and excellent yellowing and gloss resistance. The use of biobased SA also enables the polyester resins to contain more biorenewable content, and thus enables improved savings of CO2 equivalents and perhaps also the ability to formulate solvent-based systems with higher solids and thus low VOC content (compare properties of Resins 3, 4 and 5).
1 a) Coggio, W.D.; Mullen, T.; Hevus, I.; Croes, K.; Kingsley, K.; Webster, D.C.; Zweep, N. Bio-Based Succinic Acid: A Versatile Building Block for Performance Driven PUD and Coatings; Presented at American Coatings Conference Session #2, Biobased Coatings, Atlanta, GA April 2014. b) Coggio, W.D.; Schrock, A.; Thompson, B.; Ulrich, K. Modified Polyester Polyol Succinates Derived from Bio-Based Succinic Acid and Branched Glycols: Influence of Glycol Structure on Tg, Tm and Process Viscosity; Presented at UTECH-NA Conference, Charlotte, NC, June 4, 2014. c) Coggio, W.D.; Pseja, D.; Kang, C.B.; Schrock, A.; Dzadek, N. Bio-Based Succinate Polyester Polyols in Thermoplastic Urethanes; TPE Magazine, Issue 4-2015 p. 254-261.
2 A portion of these data were first presented at Coatings Trends and Technologies Conference, Chicago, IL, September 2015.
3 Unlike ASTM B117, the scribed area was not further tested by use of a scraper after exposure testing. These more aggressive tests will be conducted in the future.