Industry News
China export trade in a slow speed on March, 2015

Industry News

As Financial Times said “China’s exports slumped 15 per cent in March against a year earlier in a sharp reversal of the past two months’ growth and raising the prospect of disappointing first-quarter economic growth. “
According the export value chart of China Customs Statistics by main regions, the export value has a slowly increase by 4.7%, the import value declined by -17.6%. The main increasing region was focus on Eastern Asia countries, such like India (+23%), ASEAN (+20.6%), Malaysia (+17.7%), Thailand (+25.4%), Vietnam (+26.7%).
| %, I/E charge | %, Export charge | %, Import charge | |
| Total Value | -6.3 | 4.7 | -17.6 |
| Hongkong | -11 | -10.3 | -28.4 |
| India | 6.7 | 23 | -29.2 |
| Japan | -11.4 | -11.8 | -11 |
| Korea | -4.4 | 2.5 | -8 |
| Taiwan | – | 5.9 | -1.6 |
| ASEAN | 4.3 | 20.6 | -14.5 |
| Indonesia | -19.6 | 5.8 | -46.7 |
| Malaysia | 2.9 | 17.7 | -8 |
| Philippines | 9.1 | 13.9 | 3.4 |
| Singapore | 14.8 | 35 | -10.7 |
| Thainland | 4 | 25.4 | -12.6 |
| Vietnam | 24.3 | 26.7 | 17.3 |
| EU | -2.7 | 2.5 | -10 |
| U.K | 2.7 | 13.5 | -19.7 |
| Germany | -2.7 | 2.6 | -6.4 |
| France | -7 | -2 | -12.2 |
| Italy | -2.8 | 2.4 | -10.1 |
| Holland | -4.9 | -2.8 | -16.7 |
| Russia | -33.6 | -34.5 | -32.6 |
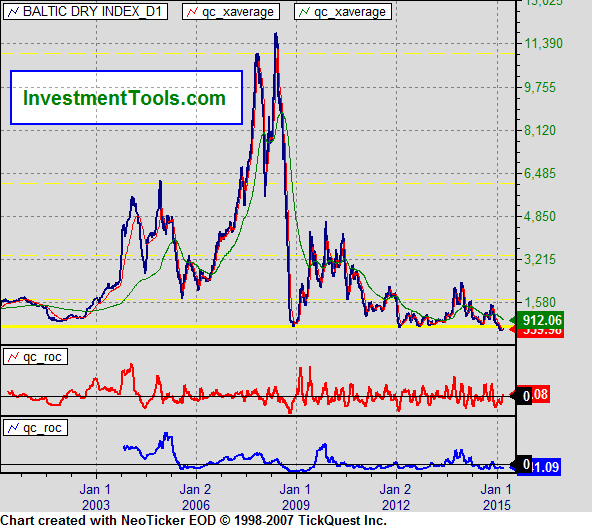
China government report said, the geopolitical risk leads to the exchange rate risk, and BDI shows the weak global trade requirements. China will continue QE policy and cut the rate.
We will increase the frequency in market reports to share our information and do a good job on trade risk control.