![[Internal Sharing Session Memo] Differences between Terpene Resins Synthesised from Different Pinene Monomers, Their Applications, and a Discussion on Resin Supply Chain Stability](https://foreverest.net/uploads/2026/03/cover-pic-terpene-resin-monomers-market-outlook_748.webp)


R&D
Application of Nonionic Surfactants based on Rosin As Corrosion Inhibitor for Tubing Steel During Acidization of Petroleum Oil and Gas Wells
R&D
Link: Electrochemsci.org
Received: 19 September 2014 / Accepted: 4 November 2014 / Published: 17 November 2014
Ayman M. Atta1,2, Gamal A. El-Mahdy1,3, Hamad A. Allohedan1 and Shymaa M. El-Saeed2
1 Surfactants research chair, Chemistry Department, College of Science, King Saud University, P.O.Box – 2455, Riyadh – 11451, Saudi Arabia.
2 Egyptian Petroleum Research Institute, Petroleum Application Department, Nasr city 11727, Cairo, Egypt.
3 Chemistry Department, Faculty of Science, Helwan University, Cairo, Egypt.
The rosin as natural product became a source for production of eco-friendly bio-surfactants which widely used in environmental protection issues. In this respect, nonionic surfactant was prepared from reaction of rosin maleic anhydride acid chloride with triethylene tetramine followed by etherification with poly (ethylene glycol600 to produce etherified rosin imide (ERIT-PEG) surfactant. The surface activity parameters of the prepared surfactant such as surface excess concentration (Γmax), the area per molecule at interface (Amin), and the effectiveness of surface tension reduction were measured in aqueous and 1M HCl solutions to determine the micellization and adsorption characteristics of the prepared surfactants at water/air interface. The inhibition effects of the etherified rosin imide (ERITPEG) surfactant on the corrosion of steel in 1 M HCl solution was studied by potentiodynamic polarization curves and electrochemical impedance spectroscopy (EIS) . Inhibition efficiency (%IE) increased with increasing inhibitor concentration. Etherified rosin imide (ERIT-PEG) surfactantacts as a mixed-type inhibitor with a capability of blocking both anodic and cathodic sites on the steel surface immersed in 1M HCl. The inhibition efficiencies calculated from EIS are in good agreement with those obtained from potentiodynamic polarization.
Electrochemical, Polariztion, EIS, steel, FTIR
The polymeric materials derived from inexpensive renewable resources (e.g., alkyl polyglucosides and bio-based polyesters) attracted more attentions due to their economic and environmental considerations [1-3]. The variety of naturally occurring structures used as parts of such “designer surfactants” ranges from simple amino acids and short peptides over carbohydrates to steroids. Rosin as natural gum attracted great attention to use as row materials for production of biobased polymers [4-10]. Rosin acids, due to their characteristic fused ring structure, are analogous to many aromatic and aliphatic compounds in rigidity. Therefore, rosin derivatives could become important alternatives to current fossil carbon-based aromatic and aliphatic monomers. Therefore, through reactions of the carboxyl group and carbon-carbon double bond in rosin acids, the resulting rosin derivatives may serve as alternatives to the petroleum-based cyclic (aliphatic and aromatic) monomers used in polymeric surfactants synthesis. The previous works have been suggested that the rosin-based polymeric surfactants would exhibit properties that have not previously been developed from other renewable resources [7-10].
Rosin acids were modified by esterification and amidation reactions to produce water soluble polymeric surfactants. Carboxylic acid group of rosin was esterified with PEG having different molecular weights to produce water soluble surfactants having different solubility in water and organic solvents [11-14]. Rosin was used to prepare different types of surfactants such as cationic [15], anionic [16], zwitterionic [17] and nonionic [18]. Inhibition of metal corrosion by organic compounds is a result of physical or chemical adsorption of organic molecules or ions at the metal surface forming protective layer reduces or prevents the corrosion of metal. The relationships between the performance and the chemical structures of the products are very important to select the suitable corrosion inhibitors. In this respect, it was found that both cationic and nonionic surfactants based on rosin exhibited good corrosion inhibition activity [10-14]. The aim of the present work is to prepare new water soluble materials based on rosin having high performance at lower concentrations as corrosion inhibitors in acid media. The objective of this work is to investigate the corrosion behavior of mild steel in 1M HCl solution in presence of the new modified nonionic surfactant based on rosin by different electrochemical techniques.
All materials were used without further purification. Rosin acid with acid number 165 mg KOH·g−1 was obtained from a commercial rosin. Maleic anhydride (MA), trietheylenetetramine (TETA), tetrahydrofuran (THF), dimethylformaide (DMF), acetate acid, petroleum ether, ethyl acetate, triethylamine (TEA), polyethylene glycol with molecular weight 600 g/mol (PEG-600), β,`β- dichloro diethyl ether, and oxalyl chloride (C2Cl2O2) were purchased from Aldrich Chemical Co.
Rosin maleic anhydride adduct (R-MA) can be prepared as previously reported [10]: Gum rosin (0.33 mol; 100 g) was heated to 180 °C and maintained at this temperature for 1 h under the nitrogen atmosphere. Maleic anhydride (0.31 mol; 30 g) was then added and stirred at 180 °C for 3 h followed by raising the temperature to 220 °C and maintaining for 1 h. The reaction was cooled to 100 °C and 200 ml acetic acid was added. The white solid powder (crude R-MA) was obtained after cooling. The crude product was recrystallized twice from acetic acid and obtained yield of 45 % (55 g) as white crystal. For all the studies, the working electrode was prepared from a single sheet of steel with the following composition (wt.%): 0.14% C, 0.57% Mn, 0.21% P, 0.15% S, 0.37% Si, 0.06% V, 0.03% Ni, 0.03% Cr and and the balance Fe. composition were Prior to the tests, the specimens were polished to mirror finish with (400, 600, 800, 1000 and 1600 and 2000) emery polishing papers, washed with distilled water, degreased with acetone and washed thoroughly with distilled water for many times and quickly immersed into the test solution after drying
a)Preparation of rosin amide
R-MA(10 g, 0.025 mol) was dissolved in 50 ml toluene and added to a round bottom flask. Oxalyl chloride (2.95 ml , 0.03 mol) 50% solution in toluene was added slowly and the reaction mixture stirred at 95-98 °C for 4 h. The HCl gas liberated in the reaction was absorbed by base solution. After removed of the unreacted oxalyl chloride by vacuum distillation, the R-MA chloride was obtained. Toluene (50 ml), TETA (5 g, 0.025 mol) and triethylamine (3.5 ml, 0.025 mol) were then added into the flask. The mixture was stirred refluxed at temperature of 98 °C for 6 h. Then the mixture was filtered, and filtrate was washed with waters to neutral the reaction filtrate and dried. Toluene was removed under reduced pressure; the corresponding rosin amide was obtained in 85 % yield.
b)Preparation of rosin imide
Rosin imide RI may be prepared as follows: TETA ( 15mmol) was diluted in 6ml of DMF in a flask fitted with a water condenser with a drying tube, a thermometer and an N2 purge tube. R-MA (10 mmol), was dissolved in 10 ml of DMF and the solution added to the diamine solution dropwise at 80°C with stirring. During addition, the temperature of the reaction mixture was raised to 135 °C and kept there for 2 hr. Water formed during imidization, was removed by distillation while fresh dry DMF was added to the reaction mixture continuously. This procedure continued for 2 hr when the reaction mixture was poured into excess water. The precipitate was filtered, washed thoroughly with water and then with diethyl ether to remove unreacted R-MA and TETA or DAB. It was finally dried at 40 °C under vacuum. The monomer produced with TETA was designated as RIT.
c) Etherification of RIT.
In 250 ml three-necked flask fitted with condenser, mechanical stirrer and thermometer the RIT monomer (0.1 mol), β,`β- dichloro diethyl ether (0.2 mol), PEG-600 (0.2 mol), NaOH (0.4 mol) and DMF (100 ml) were added together with stirring. The reactants were agitated and slowly heated to a temperature of 170°C. The reaction mixture was maintained at this temperature for 5 h. The progress of the reaction was evaluated by determine the NaCl content that increases gradually to reach a constant value at the end of the reaction. The product was treated with an equal volume of saturated NaCl solution and neutralized with dilute HCl. Then the reaction mixture was filtered then DMF removed from filtrate under vacuum. Prepare concentrated solution of NaCl at 60-70 °C. The prepare surfactant was mixed in isopropanol with ratio 1:1.The hot supersaturated solution of NaCl was mixed with surfactants isopropanol solution with ratio 1:3. The surfactants separated from isopropanol layer and dried in vacuum oven. The etherified RIT with PEG was obtained in 80 % yield.
FTIR spectra were analyzed with a Nicolet FTIR spectrophotometer using KBr in a wavenumber range of 4000–500 cm-1 with a resolution accuracy of 4 cm-1. All samples were ground and mixed with KBr and then pressed to form pellets.
1H-NMR (400 MHz Bruker Avance DRX-400 spectrometer) was used to investigate the chemical structures of the prepared rosin derivatives using CDCl3 as solvent and tetramethylsilane (TMS) as an internal reference.
The surface tension measurements of different aqueous solution of the prepared quaternary amine of diethylaminoethyl rosin ester in water and 1M HCl was measured at 25 °C by means of the pendent drop technique using drop shape analyzer model DSA-100 (Kruss, Germany). The error limits of these measurements are on the order of 0.1 mN/m or less. Pendent drops were formed on the tip of a Teflon capillary with an outside diameter of 0.1 in. and inside diameter of 0.076 in.
Both the potentiodynamic polarization studies and electrochemical impedance spectroscopic (EIS) studies were carried out by using the potentiostat (Solartron 1470E system) with Solartron 1455A as frequency response analyzer. The EIS experiments were realized in the frequency range from 10 kHz to 0.01 Hz with perturbation amplitude of 5mV peak-to-peak. Polarization data was analyzed using CorrView, Corr- Ware software. Impedance data were analyzed using Zplot and ZView software and values of charge transfer resistance Rct, solution resistance Rs and double-layer capacitance Cdl were determined using an electrical equivalent circuit. The measurements were conducted in a conventional three-electrode cylindrical glass cell with platinum electrode as auxiliary electrode and saturated calomel electrode (SCE) as the reference electrode. All polarization measurements were conducted using a scan rate of 1mV/s.
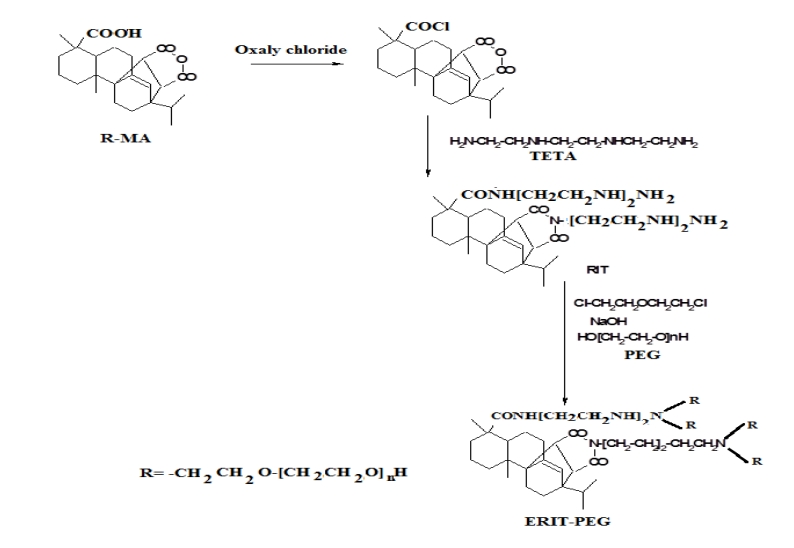
The etherified RIT –PEG surfactant xcan be prepared according the reaction scheme as illustrated in scheme 1. In this respect, Diels-Alder reaction completed between maleic anhydride and rosin acid after isomerization of rosin acid to levopimaric acid under the heat or acid condition [19]. Gum rosin was used as starting material to synthesize the R-MA. Gum rosin was heat to 180 °C and carried out the isomerization so that other resin acid would convert to levopimaric acid prior to DielsAlder reaction with maleic anhydride. The successful synthesis of R-MA was rectified by the FTIR spectrum of R-MA and showed that the formation of anhydride group is evidenced by the absorption bands at 1842cm-1 and 1778 cm-1 . The presence of preexisting carboxyl group from the resin acid is reflected by the absorption at 1693 cm-1. The structure and purity of R-MA were also confirmed by 1H NMR (500 MHz, CDCl3) δ: 5.54 (s, 1H, CH=C); 3.10 (d, 1H, CHC=O); 2.73 (d, 1H, CHC=O); 2.5 (d, 1H, CHC=CH); 2.27 (m, 1H, CCH(CH3)2) [10].
Scheme 1. Preparation of RIT-PEG surfactant
The reaction between R-MA acid chloride and TETA in the presence of TEA as acid acceptor followed by condensation of TETA with R- MA amide to produce RIT can be schematically represented in Scheme 1. The products were found to be soluble only in highly polar solvents such as dimethyl formamide, dimethyl sulfoxide, etc. The FT-IR spectra were represented in Figure 1. The characteristic IR bands of the rosin imides are observed near 1725 cm-1 and 1785 cm-1, 725 cm-1 for the cyclic imide group. The peak for the olefinic double bond appears at 1625 cm-1. The broad band at 3300 -3400 cm-1 is due to the stretching vibration of N-H system present in the imide group. However, in addition to these two peaks, the IR spectra of all the derivatives show C=O stretching at 1700 cm-1 suggesting formation of amide.
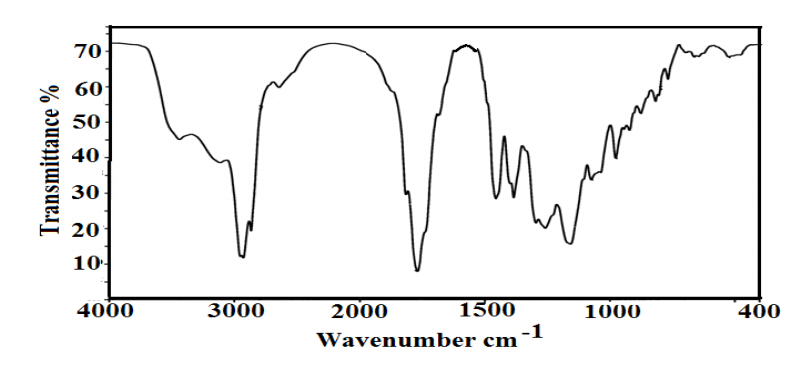
Figure 1. FTIR Spectrum of ERIT
Nonionic ERIT-PEG polymeric surfactants were prepared from the etherification of RIT monomer by using β,`β- dichloro diethyl ether and PEG 600 as reported in experimental section. The Physicochemical characterization of the prepared surfactant were listed in Table (1). 1H-NMR spectra were used to illustrate the structure of the prepared surfactants. 1H-NMR spectrum of ERIT-PEG was represented in figure 2. The protons of oxyethylene units at δ= 3.6 ppm, -OH proton of PEG and N-(CH2CH2)n-N at 4.3 ppm are observed in the spectrum of ERIT-PEG surfactants. Signal of methylene (CH2)n, appear as an intense broad band at δ = 1.35 was used to assign the incorporation of aliphatic diamines in the structure of the prepared surfactants.
| Designation | Nitrogen content (%) | Molecular weight GPC analysis (g/mol) | Inherent viscosity In DMF (0.5% W/V) at 30°C (dL/g) | Yields (wt %) | ||
| Calc. | found | Number average (Mn) | Weight average (MW) | |||
| ERIT-PEG | 3.61 | 3.70 | 3100 | 3350 | 0.18 | 90 |
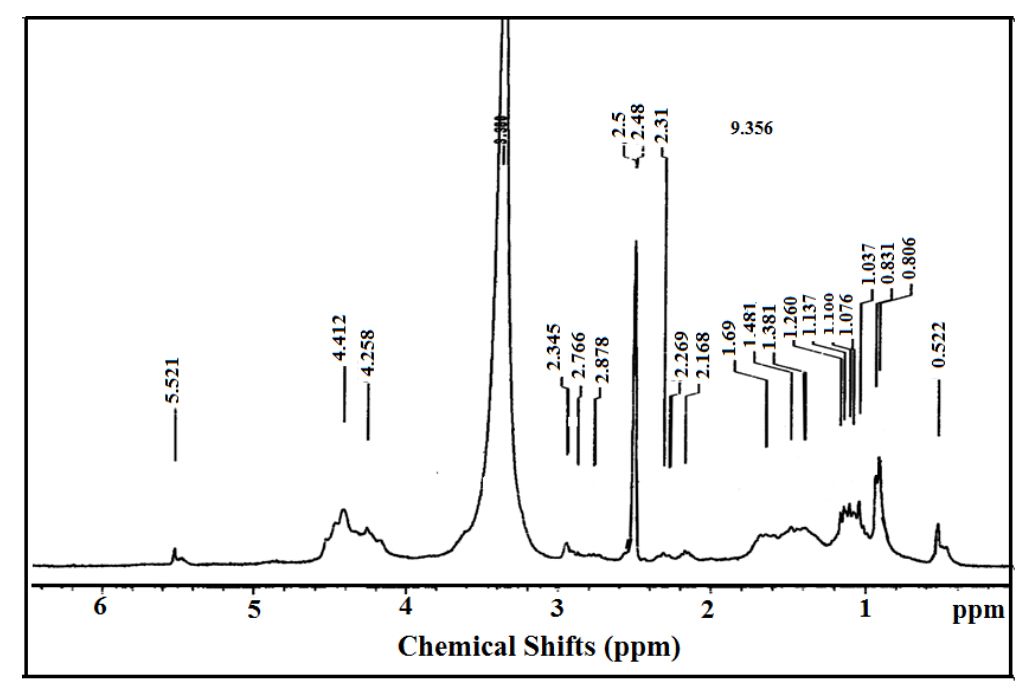
Figure 2. HNMR Spectrum of ERIT-PEG Surfactant
The ability of nonionic surfactants to adsorb at interfaces and to decrease the surface tension of aqueous acidic solution is very important criteria that determined the corrosion inhibition efficiency of amphiphilic surfactants. In this respect, the relation between the surface tension (mN/m) and Ln concentration of the prepared surfactants was used to determine the surface properties of the prepared surfactant. The adsorption isotherms of the prepared surfactants at different temperatures were plotted as representative samples in Figure 3. It is well known that the micellization, aggregation and adsorption of surfactants are based on the critical micelle concentrations (cmc), which were determined by the surface balance method as represented in figure 3. The cmc data of ERIT-PEG were determined in water and 1 M HCl aqueous solution at different temperatures from abrupt changes of the plotted data of surface tension (γ) versus the solute concentration (ln C) and listed in table 1. It was previously concluded that [15] the surface tension of the aqueous nonionic surfactant solutions was not affected by 1 M HCl. While the data of critical micelle concentrations, cmc, were reduced by 1MHCl. In the present work it was observed that both the cmc and γ were affected by 1MHCl. The data listed in table 2 indicated that the cmc values were increased from 0.00030 to 0.00055 mol/L in aqueous 1M HCl which can be attributed to the increment of solubility of ERIT-PEG due to formation of acid salts between amine groups of ERIT-PEG and HCl. It was previously reported that, increasing the cmc values indicated the high tendency of the surfactants to adsorb at the liquid interfaces [20]. These data indicated that the prepared ERIT-PEG surfactant favor micellization in bulk 1M HCl solution than aqueous solution which may reflect to its greater tendency to adsorb at metal liquid interface more than air/water interface.
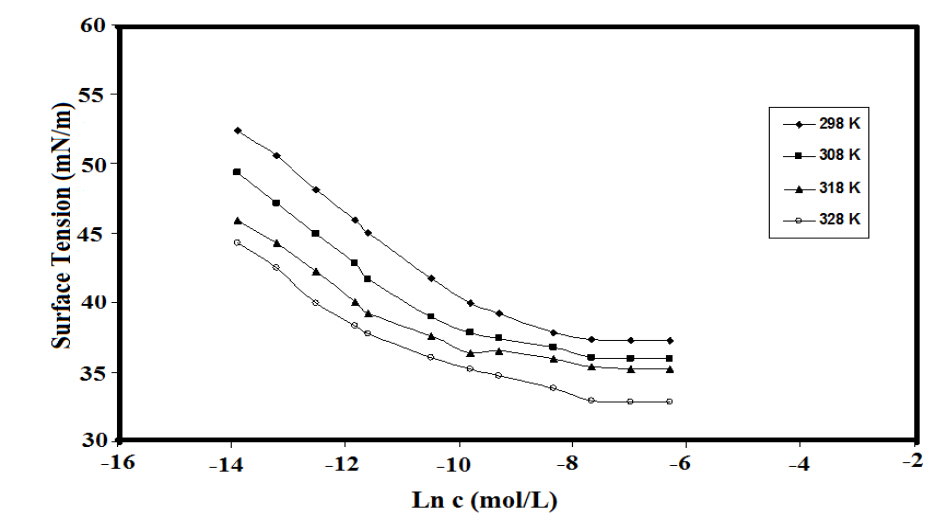
Figure 3. Adsorbtion isotherms of ERIT-PEG at different temperatures
| Solution | Surface Property | Temperature (K) | |||
| water | 298 | 308 | 318 | 328 | |
| Гmax x 1010(mol cm-2) | 1.34 | 1.27 | 1.24 | 1.2 | |
| Amin (nm2/molecule) | 0.122 | 0.13 | 0.13 | 0.14 | |
| Пcmc (mNm-1) | 35.2 | 35.1 | 34.5 | 35.1 | |
| CMCx 104 (mol/L) | 3 | 1.36 | 1.2 | 1.01 | |
| γcmc (mN/m) | 37.2 | 36.1 | 35.1 | 33.3 | |
| pC20 | 4.37 | 4.94 | 5.11 | 5.21 | |
| 1 M HCl | Гmax x 1010(mol cm-2) | 1.89 | 1.73 | 1.56 | 1.43 |
| Amin (nm2/molecule) | 0.088 | 0.096 | 0.106 | 0.116 | |
| Пcmc (mNm-1) | 37.80 | 38.80 | 37.50 | 37.30 | |
| CMCx 104 (mol/L) | 5.5 | 2.93 | 1.63 | 1.28 | |
| γcmc (mN/m) | 34.30 | 32.20 | 31.50 | 30.70 | |
| pC20 | 5.23 | 5.52 | 5.96 | 6.12 | |
On the other hand, the surface activity data of ERIT-PEG such as the surface tension at cmc, γcmc, effectiveness of the prepared surfactants expressed by the maximum reduction of surface tension which calculated from the equation, ∆γ= γwater – γcmc, the concentration of the prepared surfactants at the solvent–air interface, Гmax, and the area per molecule at the interface, Amin, were calculated and listed in table 2. The effectiveness of surface tension reduction, пCMC, in these compounds shows a steady increase in 1 M HCl solution. The effectiveness of adsorption, however, may increase, depending on the orientation of the surfactant at interface. If the surfactant water interaction increased more than water-water interaction the arrangement of surfactant molecules is predominantly perpendicular but not close-packed [21]. The efficiency of the surfactants (PC20)to reduce the surface tension to 50 mN/m was determined from the relation, PC20= – log concentration at γ equals 50 mNm, and listed in Table 2. The efficiency of the prepared surfactants, listed in Table (2), increases in 1 MHCl and with increasing temperature This can be attributed to the fact that, the nonionic surfactants having aliphatic linear aliphatic or cyclic aliphatic hydrophobic groups are more easier for packing at the interface. The surface excess concentration of the prepared surfactants at the interface can be calculated from surface or interfacial tension data using the following equation [22]: Гmax=1/RT x (-∂ γ/∂ ln c)T, where (−∂γ/∂ ln c) T is the slope of the plot of γ versus ln c at constant temperature (T), determined from figure 3, and R is the gas constant (in J mol−1 K−1). The Гmax values were used for calculating the minimum area Amin at the aqueous–air interface. The area per molecule at the interface provides information on the degree of packing and the orientation of the adsorbed surfactants, when compared with the dimensions of the molecule as obtained from models. From the surface excess concentration, the area per molecule at the interface is calculated using the equation: Amin = 1016/ NГmax, where N is Avogadro’s number. The data, Table 2, indicated that the increases the surface excess of molecule and consequently, decreases Amin of molecule at air/water interface was observed in 1 MHCl aqueous solution. This behavior can be attributed to increment of hydrophilic interaction at interface, which increase in 1 M HCl due to protonation of basic amine groups of ERITPEG in 1 M HCl. These data indicated that the prepared surfactants are strongly adsorbed at interfaces in 1M HCl solutions.
The polarization curves shown in Figure 4 were recorded in 1.0 M HCl solutions without and with different concentrations of ERIT-PEG Surfactant. It is observed that the current density of the anodic and cathodic branch is displaced toward lower values. The displacement in both curves of each inhibitor concentration is more evident by increasing the inhibitors concentrations compared to the blank curve.The results indicates that the inhibitors can be classified as mixed inhibitors [23-26]. The corresponding electrochemical parameters including corrosion potential (Ecorr), Tafel slopes (ba, bc) and corrosion current density (Icorr) are given in Table 3. It is clear from Table 3 that the value of the current density in uninhibited 1 M HCl solution was decreased considerably by the increase of the inhibitors concentrations in the aggressive solution, which reflects the inhibiting action of the used inhibitors. The decrease in corrosion current density of blank solution by the addition of inhibitors can be accounted to the adsorption of the inhibitor molecules on the steel surface, which blocked the active sites of the steel and reduced corrosion current density [27]. Hence, it can be concluded that the ERIT-PEG Surfactant retards both the anodic dissolution of steel and cathodic reduction at cathodic sites in the corrosion process and its cathodic action being more pronounced. The inhibition efficiency IE (%) was computed using the equation [28-30]:
%IE = icorr – icorr(inh)/icoor (1)
where icorr and icorr(inh) are the values of corrosion current density of uninhibited and inhibited specimens, respectively. The inhibition efficiency (IE%) calculated from the potentiodynamic polarization curves are presented in Table 3.The results show that the addition of the ERIT-PEG Surfactant causes an increase in %IE at all concentrations and maximum IE was obtained at 100ppm of the ERIT-PEG Surfactant concentration in 1M HCl.The observed increase in IE at higher inhibitor concentrations can be attributed to covering more surface area of the steel surface with ERIT-PEG Surfactant. It has been commonly concluded that the inhibition mechanism can be explained on the basis that the inhibitor molecules get adsorbed on the steel surface and form a barrier layer to block the corrosion process. Moreover, the anodic metal dissolution and the cathodic reaction decrease upon increasing the concentration of inhibitor.
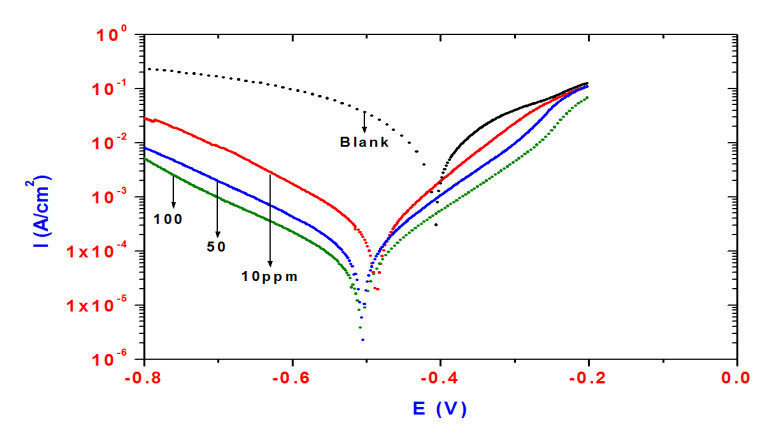
Figure 4. Polarization curves for steel in 1MHCl solution containing different concentration of ERIT-PEG Surfactant
| Polarization Method | EIS Method | |||||||
| Ba (mV) | Bc (mV) | Ecorr (V) | icorr, μA/cm2 | IE% | Rp, Ohm | Cdl (μF/cm2) | IE% | |
| Blank | 69 | 120 | -03995 | 839 | 1.80 | 334 | ||
| 10 ppm | 92 | 127 | -0.4865 | 228 | 72.82 | 6.1 | 174 | 70 |
| 50 | 104 | 150 | -0.5052 | 104 | 87.6 | 14.6 | 118 | 87 |
| 100 | 109 | 159 | -0.5062 | 59 | 92.96 | 23 | 109 | 92 |
Figure 5 shows the Nyquist diagrams for steel in 0.1 M HCl solution with and without inhibitors. The impedance spectra consist of large capacitive loop, which is related to the charge transfer of the corrosion process occurred on steel surface. Noticeably, the diameter of the capacitive loop in the presence of inhibitor is bigger than that in the absence of ERIT-PEG Surfactant (blank solution).It increases with increasing inhibitor concentration. This indicates that the impedance of inhibited steel increases with the addition of the ERIT-PEG Surfactant to the solution and decreases the corrosion process. The impedance spectra for the Nyquist plots were appropriately analyzed by fitting to the equivalent circuit model shown in Figure 6. Rs, Rct and CPE are the solution resistance, charge transfer resistance and constant phase element, respectively. The impedance of CPE was used to replace double layer capacitance (Cdl) for a more accurate fit, which is described as follows [31–33]:
ZCPE = Y0-1(Jω)-n
where Y0 is a proportional factor, j2 = -1 is an imaginary number, and ω is the angular
frequency (ω= 2πf) . If n = 1, the impedance of CPE is identical to that of a capacitor, and in this case Y0 gives a pure capacitance (C). Depending on the value of n, CPE can represent a resistance (ZCPE = R, n = 0), a capacitance (ZCPE = C, n = 1), a Warburg impedance (ZCPE = W, n = 0.5) and inductance (ZCPE =L, n = -1). In all cases, the CPE used during the fitting process of the experimental impedances data is associated with capacitive impedance. The impedance parameters listed in Table 3 reveals that Rct values in presence of ERIT-PEG Surfactant are lower than those experienced in the blank solution. This indicates that the fitted data have good agreement with the experimental data. Generally, a large Rct is associated with a slower corroding system. The decrease in double layer capacitance (Cdl) comparing with that in blank solution (without inhibitor), can be attributed to a decrease in local dielectric constant and/or an increase in the thickness of the electrical double layer. In addition, the more the inhibitor is adsorbed, the greater the thicknesses increase of the barrier layer. The result of EIS data suggests that the inhibitor molecules function by adsorption at the steel/solution interface. The value of Rct is a measure of the electron transfer across the surface and is inversely proportional to corrosion rate. The semicircle shaped Nyquist plots indicate the formation of a barrier on the surface and a charge transfer process mainly controlling the corrosion of steel. The inhibition efficiency (%IE) is calculated from Rct using the following relation:
IE% = 1-Rct(1)/Rct(2) × 100 (2)
where Rct(1) and Rct(2) are the charge transfer resistances in the HCl solution in the absence and in the presence of the inhibitors, respectively. Evidently, %IE increases with an increase in the inhibitor concentration, which confirms that ERIT-PEG Surfactant can greatly promote anti-corrosion capability for corrosion of steel in acidic chloride solution.
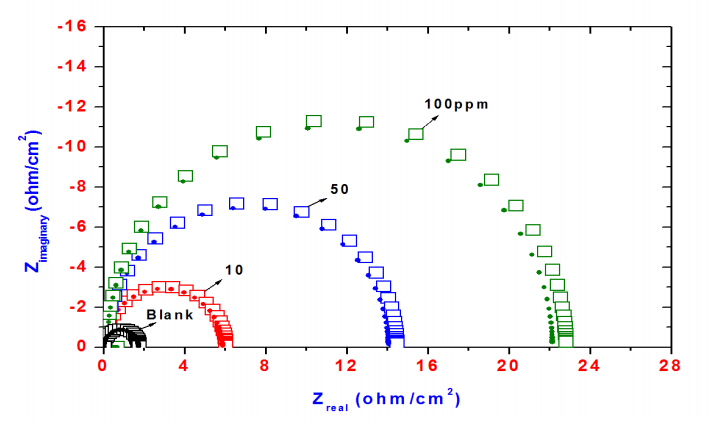
Figure 5. Nyquist diagrams for steel in 1MHCl solution containing different concentration of ERIT-PEG Surfactant
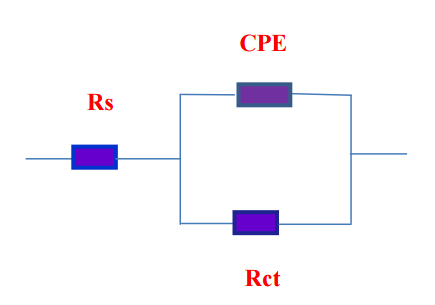
Figure 6. Equivalent circuit employed for fitting experimental data
The percentage inhibition efficiencies calculated from the Rct values indicate that ERIT-PEG Surfactant acts as a good corrosion inhibitor for corrosion reaction of steel in 1 M HCl solution. The impedance of steel increases due to increasing the surface coverage of ERIT-PEG Surfactant on the steel surface [34], which results in an increase in the inhibition efficiency. Adsorbed ERIT-PEG Surfactant molecules form a protective film, which insulates the steel surfaces and inhibits both cathodic and anodic reactions of steel surface [35]. The inhibition efficiencies calculated from EIS are in good agreement with those obtained from potentiodynamic polarization.
The project was supported by King Saud University, Deanship of Scientific Research, Research Chair
1. E. Gubbels, J.P. Drijfhout, C. P-v. Tent, L. Jasinska-Walc, B.A.J. Noordover, C. E. Koninga, Progress in Organic Coatings , 77 (2014) 277.
2. M. Haq, R. Burgueño, A. K. Mohanty, M. Misra, Composites Science and Technology, 68 (2008) 3344.
3. G. Totaro, L. Cruciani, M. Vannini, G. Mazzola, D. Di Gioia, A. Celli, L. Sisti, European Polymer Journal, 56 (2014) 174.
4. J. Zhang, Rosin Based Chemicals and Polymers, A Smithers Rapra Technology Ltd., UK (2012) 56.
5. A.M. Atta, R. Mansour, M. I. Abdou, A. M. Sayed. Polym. Adv. Technol. 15 (2004) 514.
6. A. M. Atta A. M. Elsaeed, R.K. Farag, S. M. El-Saeed React. Funct. Polym. 67 (2007)549.
7. A. M. Atta, A. M. Elsaeed, J. Appl. Polym. Sci. 122 (1) (2011)183.
8. A.M. Atta, A.M. Ramadan, K. A. El-Shafay, A. M. Mohamed, N.S. Ragab, M. Fekry, J. Disp. Sci. Technol. 30 (2009)1100.
9. 9. A.M. Atta, M. E. Abdel-Rauf, N. E. Maysour, A. K. Gafer, J. Disp. Sci. Technol. 31 (2010)583–595.
10. A.M. Atta, G.A. El-Mahdy, A. K. F. Dyab, H.A. Allohedan, Int. J. Electrochem. Sci., 8 (2013) 9629 – 9643.
11. A.M. Atta, G. A. El-Mahdy, H. S. Ismail, H.A. Al-Lohedan Int. J. Electrochem. Sci., 7 (2012) 11834.
12. G. A. El-Mahdy, A.M. Atta, H. A. Al-Lohedan, Int. J. Electrochem. Sci., 8 (2013) 5052.13. A. M. Atta, G. A. El-Mahdy, A. A. Al-Azhary, H. A. Al-Lohedan Int. J. Electrochem. Sci., 8(2013) 1295.
14. A. M. Atta, G. A. El-Mahdy, A.M. ELsaeed, H. A. AL-Lohedan, Digest Journal of Nanomaterials and Biostructures, 9 ( 2014) 1047 – 1058.
15. W.H. Jia, X.P. Rao, Z.Q. Song, S.B.Shang, J. Surf. Det., 12 (2009)261.
16. W.H. Jia, Z.Q. Song, S.B.Shang, X.P. Rao, Biomass Chemical Engineering, 42 (2008)6.
17. H. S. Wang, R.C. Zhang, S.L.Zhao, L.D. Tang, Y.M.Pan, Analytica Chimica Acta, 560 (2006)4.
18. R.S. Wei, W.G. Duan, Z.Ceng, B. Cen, H.Q.Zhang, Applied Chemical Industry, 35 (2006)833.
19. A.M. Atta, A.M. Ramadan, K. A. El-Shafay, A. M. Mohamed, N.S. Ragab, M. Fekry, J. Disp. Sci. Technol. 30 (2009)1100.
20. D. Asefi, M. Arami, A.A. Sarabi, N.M. Mahmoodi, Corros. Sci. 51 (2009) 1817.
21. J. Bo, L. Bjorn, H. Krister, K.Bengt, “Surfactants and Polymers in Aqueous Solution”, John Wiley & Sons Ltd., New York (1998) 45.
22. M.J.Rosen, “Surfactants and Interfacial phenomena”, John Wiley and Sons, New York (1978) 25.
23. M.A. Hegazy, M.F. Zaky, Corros. Sci. 52 (2010) 1333.
24. Q. Deng, H.W. Shi, N.N. Ding, B.Q. Chen, X.P. He, G. Liu, Y. Tang, Y.T. Long, G.R. Chen, Corros. Sci. 57 (2012) 220.
25. A.K. Sataphathy, G. Gunasekaran, S.C. Sahoo, K. Amit, P.V. Rodrigues, Corros. Sci. 51 (2009) 2848.
26. S. John, B. Joseph, K.K. Aravindakshan, A. Joseph, Mater. Chem. Phys. 122 (2010) 374.
27. A. Khamis, M.M. Saleh, M.I. Awad, Corr. Sci. 66 (2013) 343.
28. Q. Qu, Z. Hao, L. Li, W. Bai, Z. Ding, Corros. Sci. 51 (2009) 569.
29. F. Bentiss, M. Lebrini, M. Lagrenée, Corros. Sci. 47 (2005) 2915.
30. Q. Qu, S. Jiang, W. Bai, L. Li, Electrochim. Acta 52 (2007) 6811.
31. M. Tourabi, K. Nohair, M. Traisnel, C. Jama, F. Bentiss, Corros. Sci. 75 (2013) 123.
32. B. Xu, Y. Liu, X. Yin, W. Yang, Y. Chen Corros. Sci. 74 (2013) 206.
33. N. Soltani, N. Tavakkoli, M. Khayatkashani, M.R. Jalali, Corros. Sci. 62 (2012) 122.
34. A.M. Fekry, R.R. Mohamed, Electrochim. Acta 55 (2010) 1933.
35. M. Lebrini, M. Lagrene´ e, H. Vezin, M. Traisnel, F. Bentiss, Corros. Sci. 49 (2007) 2254.
© 2015 The Authors. Published by ESG (www.electrochemsci.org). This article is an open access article distributed under the terms and conditions of the Creative Commons Attribution license (http://creativecommons.org/licenses/by/4.0/).